TABLE OF CONTENTS
ADMIN PRIVILEGES REQUIRED
Overview
Microsoft Power BI (business intelligence) is a data visualization product that allows you to create interactive charts and reports.
There are many ways to connect Stack Internal Community to Power BI to create a data dashboard from your Stack Internal Community data. In this example, you'll use the Stack Internal Community API v3, an automation job, Node.js, and Power BI datasets.
This document demonstrates just one way to create a Power BI data dashboard with Stack Internal Community API v3. Because of the many variables involved, Stack Overflow does not offer support for connecting your Stack Internal Community API to Power BI.
Components of the data dashboard
A Stack Internal Community data dashboard is useful for teams who want to monitor and improve their site's engagement. The dashboard is a quick and easy way for teams to see how many new questions are asked, how many remain unanswered, etc. There are many insights to be gleaned from your Stack Internal Community data.
Stack Overflow offers an API for data access. In this example, you'll use an automation job to pull data from the API into a local JSON file, then connect Power BI to that file.
Below is an overview of how the Stack Internal Community API connects to the Power BI dashboard.
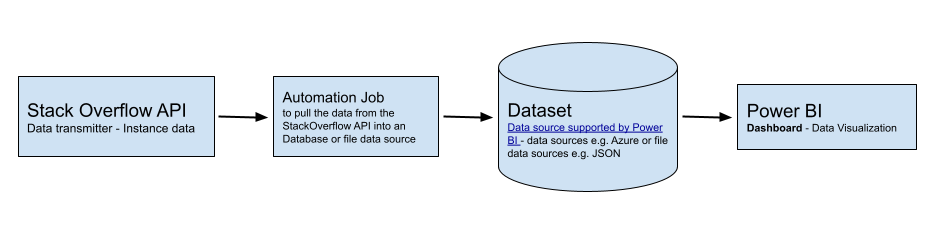
These instructions demonstrate just one of the many ways you can connect your Stack Internal Community API to Power BI. For this example, you'll use the following components:
-
Stack Internal Community API
You'll access a Stack Internal Community API v3 endpoint with your personal access token (PAT) to query question data, specifically questions the site considers unanswered. These questions may have answers, but none has an accepted or upvoted answer. The v3 request usesisAnswered=false&hasAcceptedAnswer=falseon the Teams questions route. -
Data Source
You'll store dashboard data in a separate data source. Power BI supports many data sources. In this example, you'll use a local JSON file for simplicity. -
Automation Job
You'll use scheduled automation (a cron job) in a Node.js application to pull data from the Stack Internal Community API and push it to the data source. -
Power BI
You'll use datasets and reports in Power BI Desktop to create your dashboard. The automation cron job will update the data in your file daily.
Install and configure the Node.js application
This document assumes you already have Node.js installed locally.
Download and unzip the API v3 Node.js application. In the unzipped powerbi-api-dashboard-v3 folder, install the dependencies using npm ci. Learn more about npm from the official npm docs.
The downloaded application already contains API v3 code. Copy .env.template to .env, then set these values for Basic or Business. Leave API_KEY blank:
API_KEY=
API_TOKEN=your_read_only_PAT
BASE_URL=https://api.stackoverflowteams.com
API_ROUTE=/v3/teams/your_team_slug/questions
FILENAME=APIDashboardData.json
USER_AGENT=your-company-powerbi-dashboard/1.0 (https://your-company.example; admin@your-company.example)
Replace the PAT, team slug, and USER_AGENT examples with your own values. Create a read-only PAT for the Team named in API_ROUTE as described in Personal Access Tokens (PATs) for API Authentication. API v3 puts the team slug in the URL, not in a team query parameter. Keep the PAT in .env; the downloaded application's .gitignore excludes that file.
Run the program using node index.js. The first API request runs immediately and creates APIDashboardData.json. The program then continues to run until it's stopped. You can stop the script and cron job at any time by pressing CTRL-C.
To pull the data into Power BI:
- Click Get data - more.
- Click JSON and select
APIDashboardData.json. - If Power Query displays a list, convert it to a table and expand the question fields you want in your report, such as
id,title,answerCount, andviewCount. See Microsoft's JSON connector instructions.
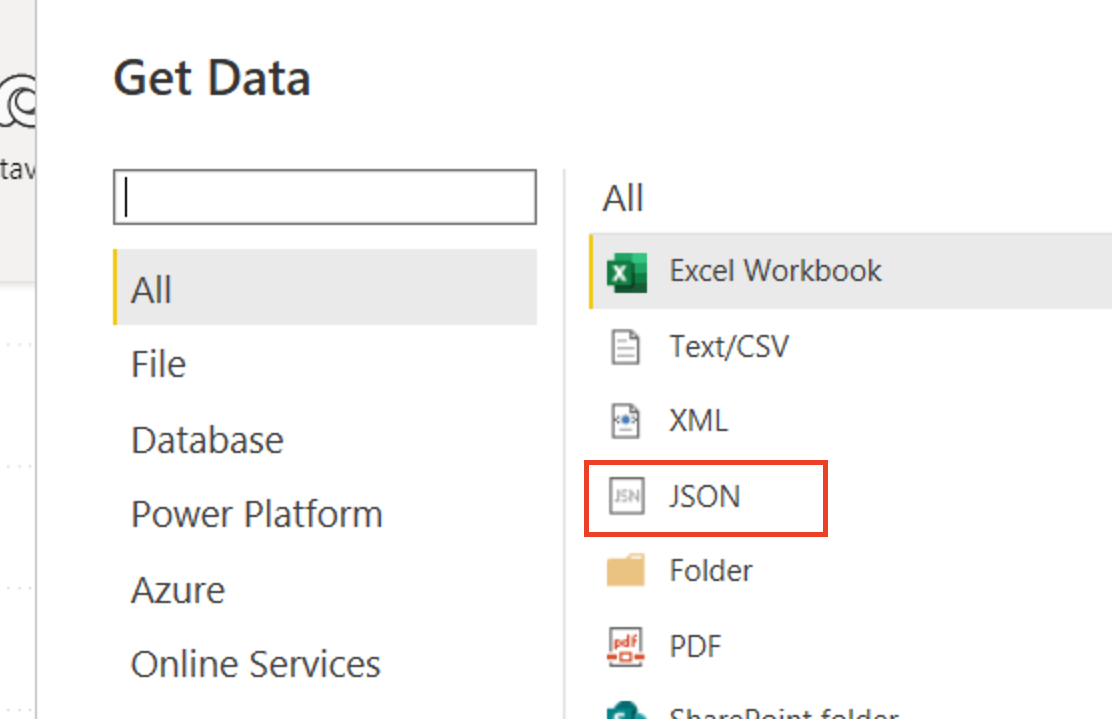
Power BI will pull the data into the report.
You can now build reports and visualize your Stack Internal Community data. Read this Microsoft Power BI quickstart guide for more information on creating reports and charts.
You'll need to perform a one-time, manual refresh in Power BI Desktop by clicking Refresh on the Home ribbon after the JSON file changes. This refreshes the data in the report's model from the file.
How it works
Understanding how the Node.js code works will help you make changes to better meet your own reporting needs. We'll explain the key functions in the included index.js file below to highlight the flexibility and limitations of this Power BI implementation.
This example shows just one of many possible ways to build a Power BI dashboard using the Stack Internal Community API. You can modify the script to connect to other visualization tools.
Build the API request
The buildRequest(page) function builds a v3 request using the values in .env. It sends the PAT as a bearer credential in the Authorization header and includes a descriptive User-Agent header.
The request calls /v3/teams/[your_team]/questions with isAnswered=false and hasAcceptedAnswer=false. Together, these select questions with neither an upvoted nor an accepted answer. It also sets pageSize=100 and the current page number. The sort=creation&order=asc parameters order questions by creation date. Your interactive API v3 documentation lists the supported routes and query parameters.
API v3 returns paginated question lists. The script requests each page until it reaches totalPages. The list can change while the script is running, so a run isn't a point-in-time export. To retrieve a different type of data, you'll need to change API_ROUTE, the query parameters, and the response fields the script reads.
Make the API call
The makeRequest() function uses the axios HTTP client to make asynchronous API calls. Each response has an items array and totalPages value. The function collects all pages and removes any duplicate questions by their v3 id field.
API v3 uses camelCase response fields such as answerCount and viewCount. Each question in the list has an id field that uniquely identifies it.
Write data to the data source
The writeDataToFile() function writes the question data to the JSON file. This is the data you'll load into Power BI.
If you choose a different file or database, consider the following:
- Your script shouldn't create a new file or database table every time the cron runs. Use the same file or database table each time.
- Your script shouldn't append each run's data to the file or table. A question can leave the unanswered list after it receives an accepted or upvoted answer, so each run should replace the previous list with the latest result.
The example script collects all pages before writing the file. If an API request fails, it leaves the previous file in place. Within a run, it deduplicates questions by id; it doesn't combine the new list with data from earlier runs.
Run the script
The cron job calls fetchAndWriteData(), which combines makeRequest() and writeDataToFile(). The function waits for all API pages, then writes the resulting question list to the data file. It also runs once when you start the application, so you can load the file into Power BI right away.
Build an automation job
The const nodeCron command loads the node-cron library, which is required to schedule an automation job.
The nodeCron.schedule() call runs fetchAndWriteData() every day at midnight in the computer's local time zone. The separate fetchAndWriteData() call runs it once when you start the script.
When setting your cron schedule, consider the rate limits and throttles imposed by the Stack Internal Community API. A run makes one request for each page of questions. Learn more in the API v3 Overview.
You can use other automation tools to create cron jobs, such as Azure's WebJob when using an Azure SQL database.
More on data sources
This example uses a simple JSON file as the data source. A file can work well when the data set is small. For larger data sets, consider a database. To use a database (Azure, for example), you'll need to prepare SQL tables for the data and change the write function to include SQL queries.
Power BI Desktop reads the updated local file when you click Refresh. If you publish the report to the Power BI service and want scheduled refresh from a local file, you'll need an on-premises data gateway. You can also use a supported cloud data source, such as OneDrive or SharePoint Online, and configure refresh for that source. See Microsoft's data refresh guidance.